

Weekly Equity Market Outlook: Global Geopolitics and Q4FY26 Results to Guide Market Direction
Interesting Charts
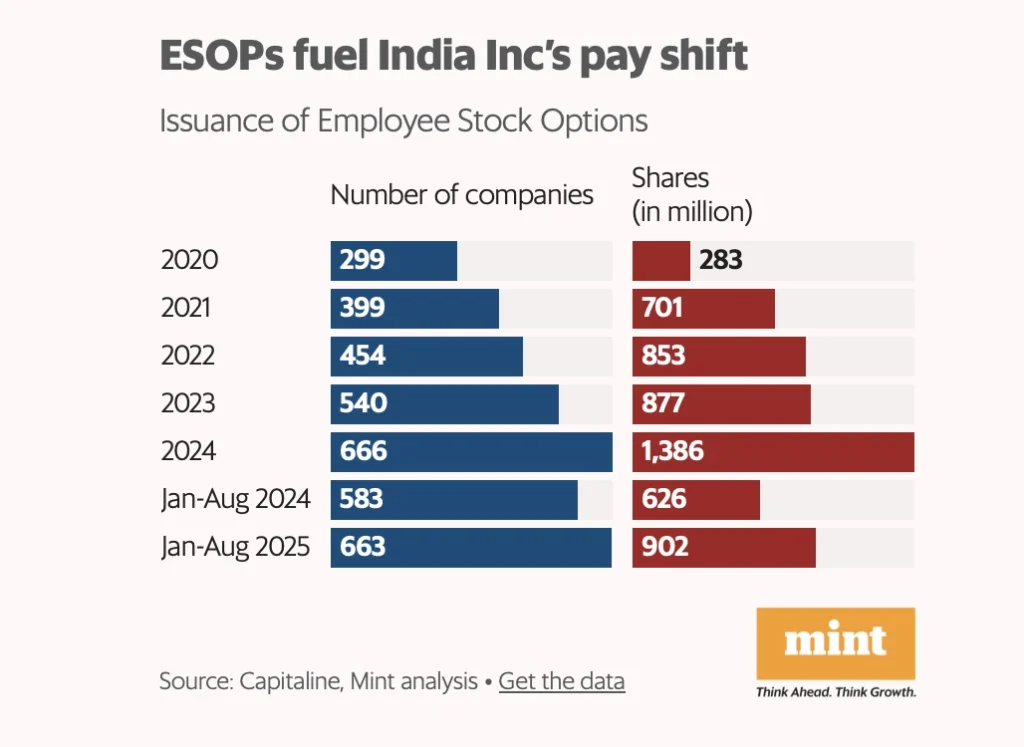
The number of companies issuing ESOPs rose from 299 in 2020 to 666 in 2024, while shares granted jumped nearly fivefold. In 2025, the trend continues strong with 663 firms issuing 902 million shares by August.
3.India’s Exports to US Slow Sharply to 9-Month Low
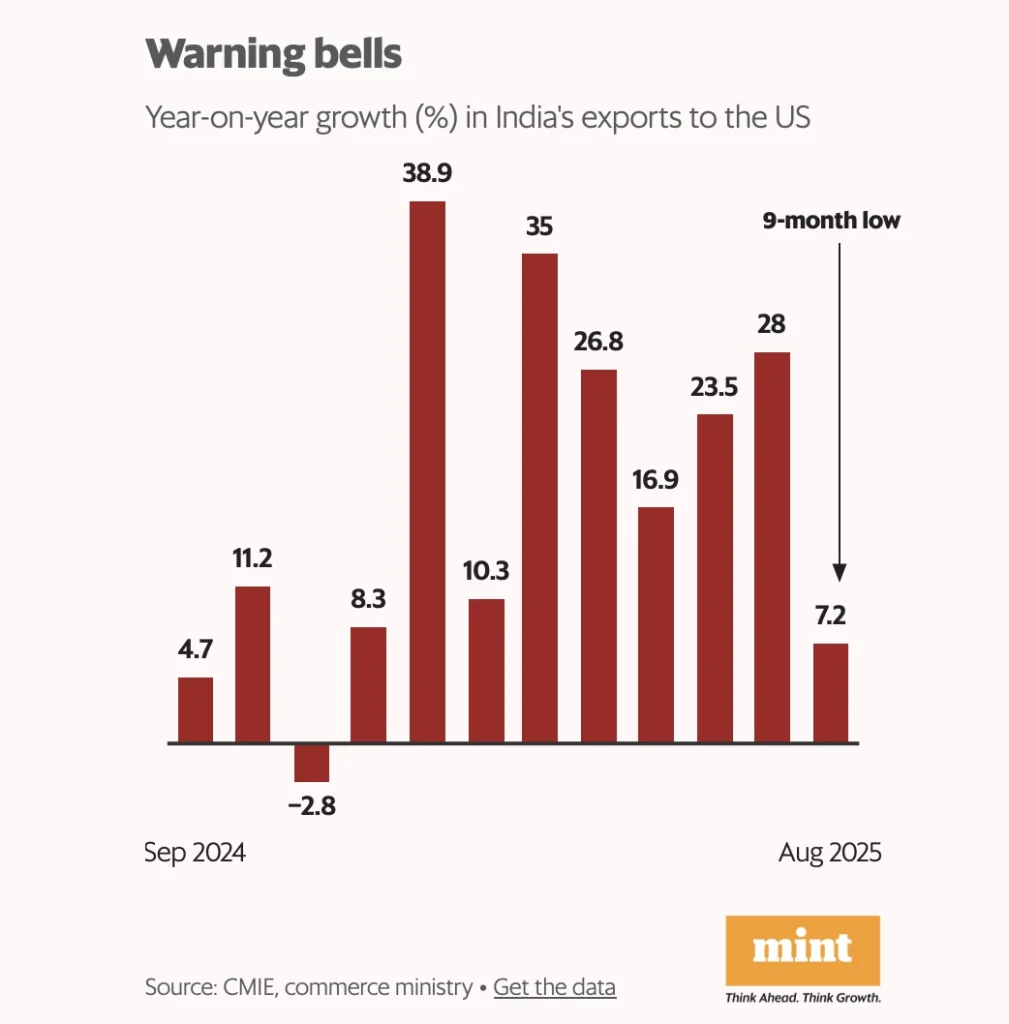
Year-on-year export growth to the US dropped to just 7.2% in August 2025, a sharp fall from highs of nearly 39% earlier in the year. The decline signals weakening demand and potential pressure on India’s trade outlook.
4.Disinflation Spreads Across Asia as Demand Weakens
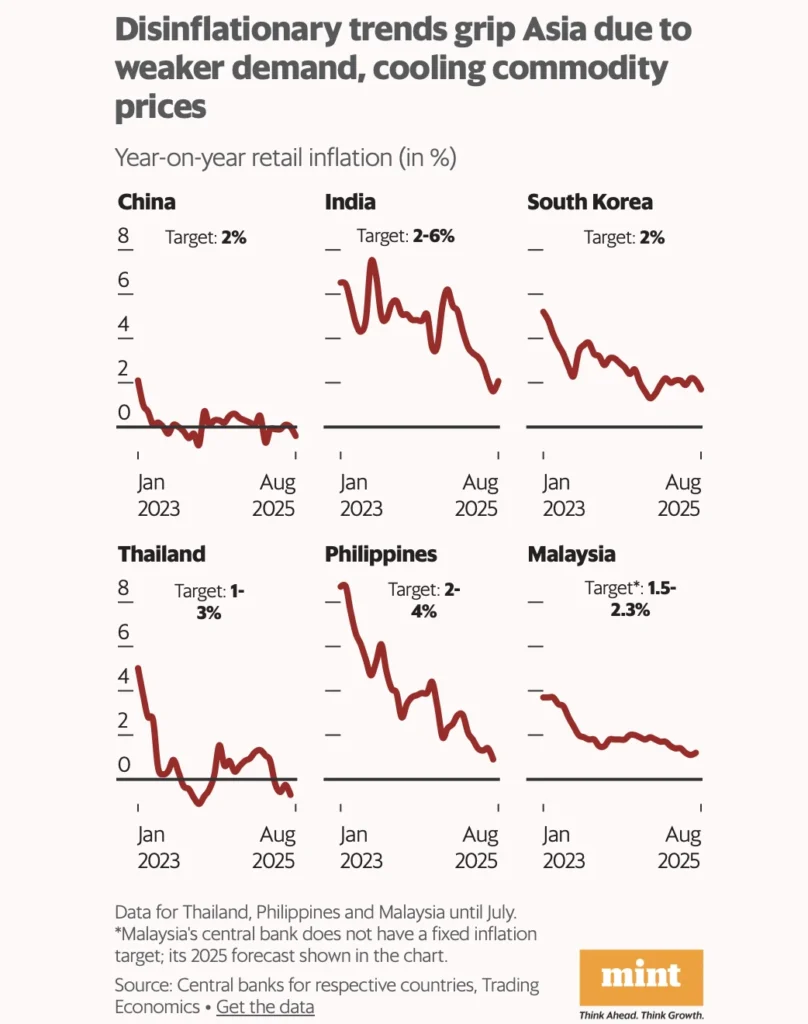
Retail inflation has fallen sharply across Asia, with China, Thailand, and Malaysia already near or below 0% by mid-2025. India, South Korea, and the Philippines also saw easing price pressures, reflecting weaker demand and cooling commodity prices.
5.ETFs Outpace Mutual Funds as Investor Preference Shifts in the US
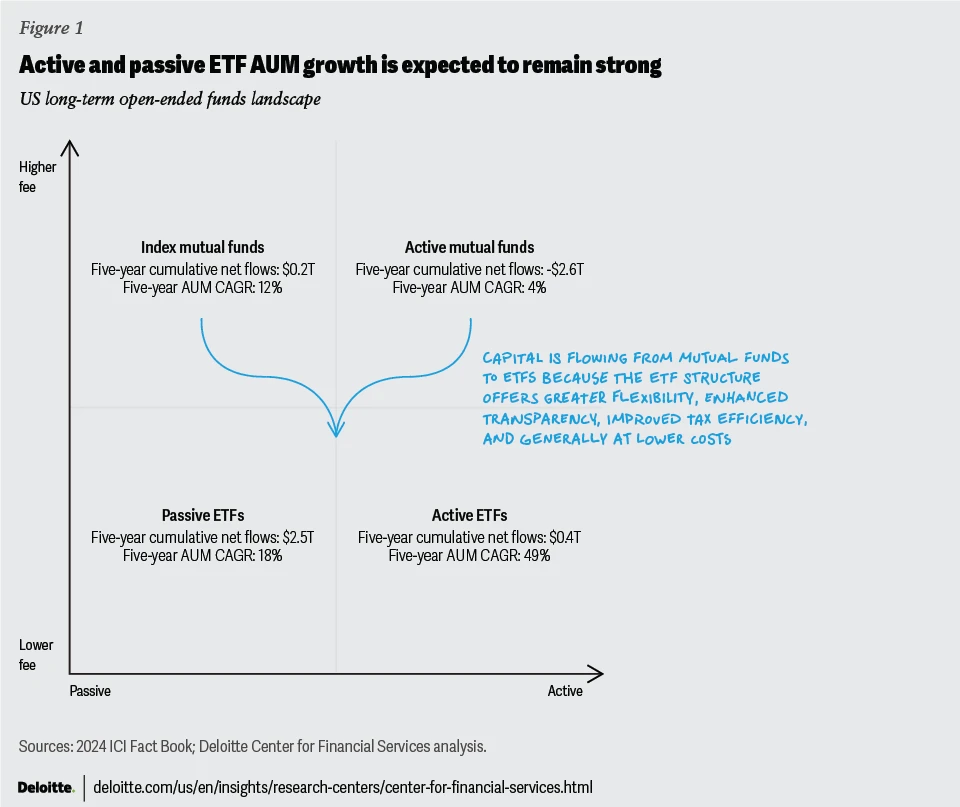
Over the past five years, passive ETFs attracted $2.5T in net flows with 18% AUM CAGR, while active ETFs grew fastest at 49% CAGR. Traditional mutual funds, especially active ones, saw significant outflows as investors favoured ETFs for flexibility, transparency, and cost efficiency.
6.Deposit Costs to Stay Elevated Above Historical Averages
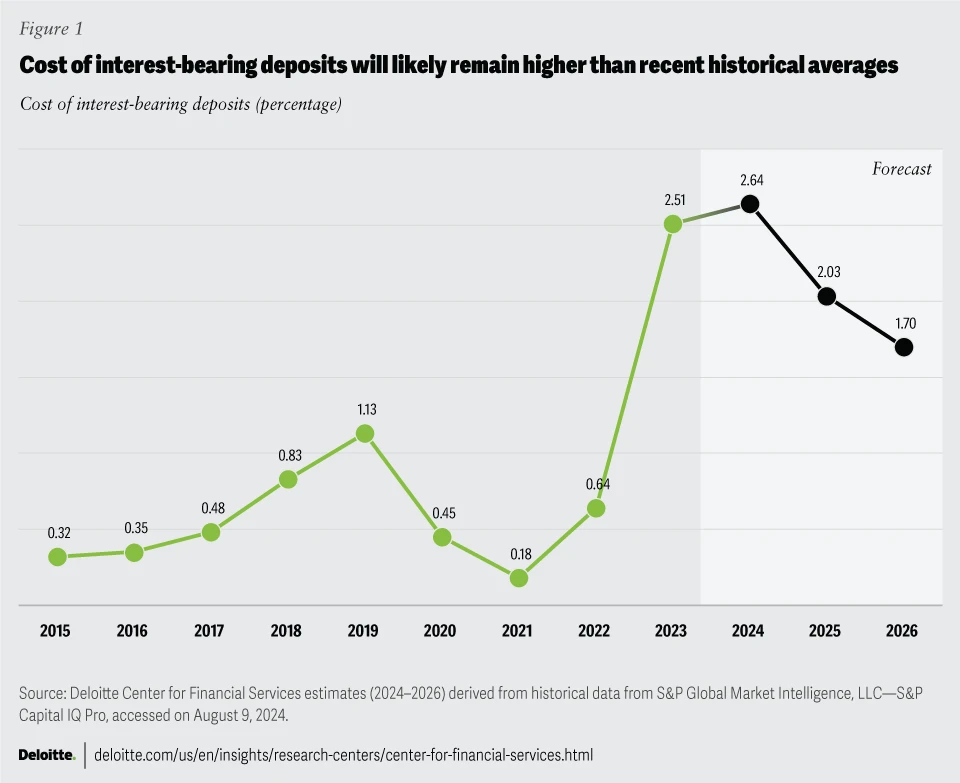
After climbing sharply to 2.64% in 2024, the cost of interest-bearing deposits is projected to ease but remain above pre-2022 levels. Forecasts suggest a decline to 1.7% by 2026, yet still much higher than the sub-1% averages seen before the rate hikes.
7.India Among Global Leaders in AI Skills Adoption
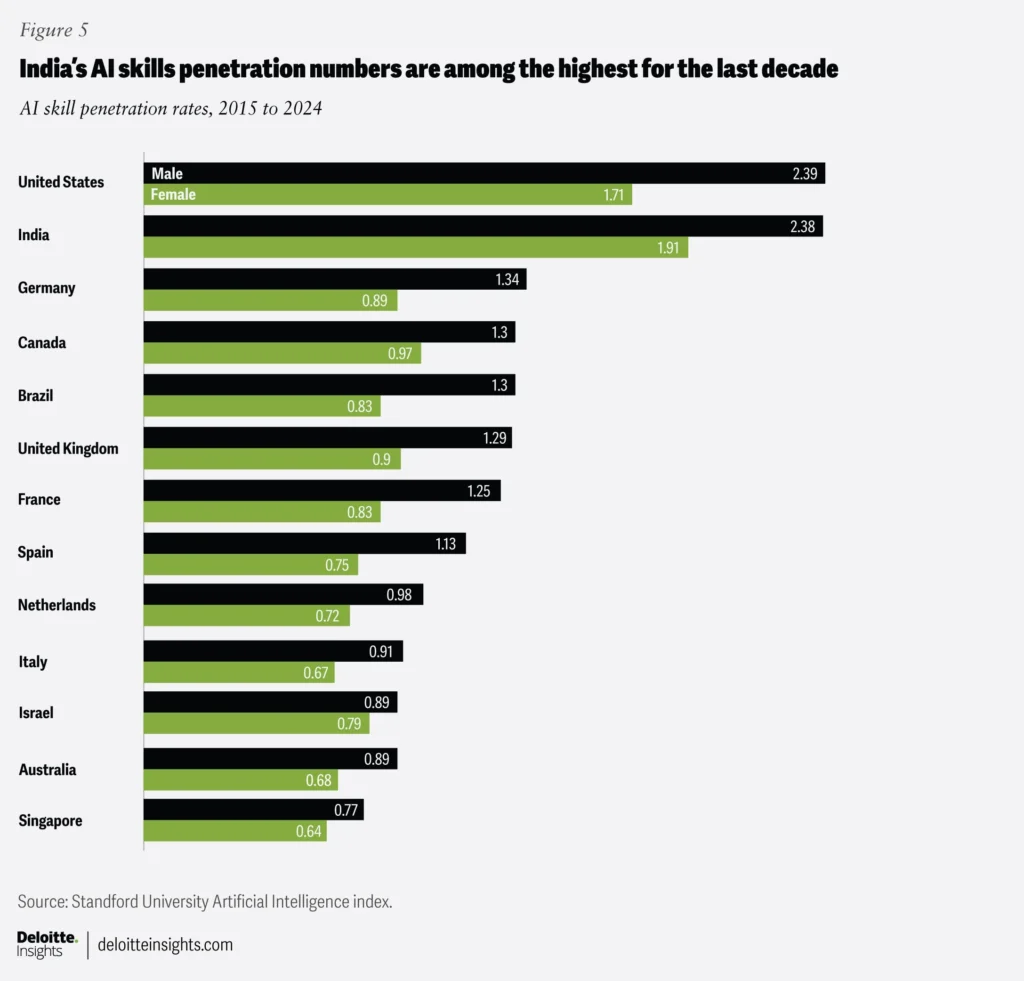
India ranks second only to the US in AI skill penetration, with male (2.38) and female (1.91) rates among the highest globally. This reflects rapid digital upskilling and positions India as a strong talent hub in the global AI ecosystem.
8.India’s MedTech Industry to Triple Global Growth Rate
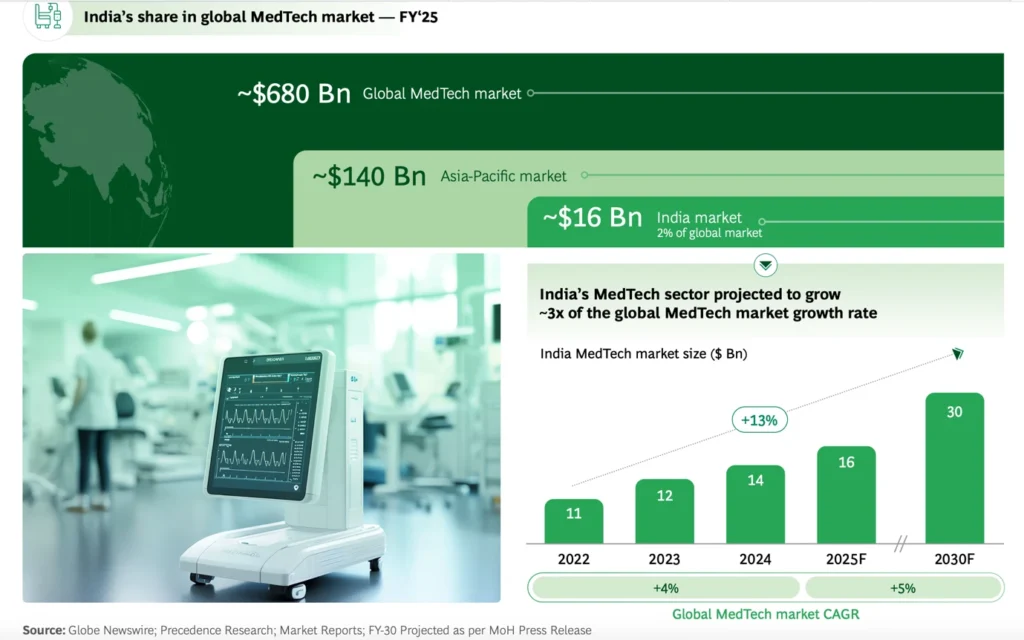
With a current market size of ~$16B (2% of global share), India’s MedTech sector is projected to grow at 13% CAGR, far outpacing the global average of 4–5%. By 2030, the market is expected to nearly double to $30B, driven by rising demand and healthcare investments.
9.India Cuts Import Dependence as MedTech Exports Surge
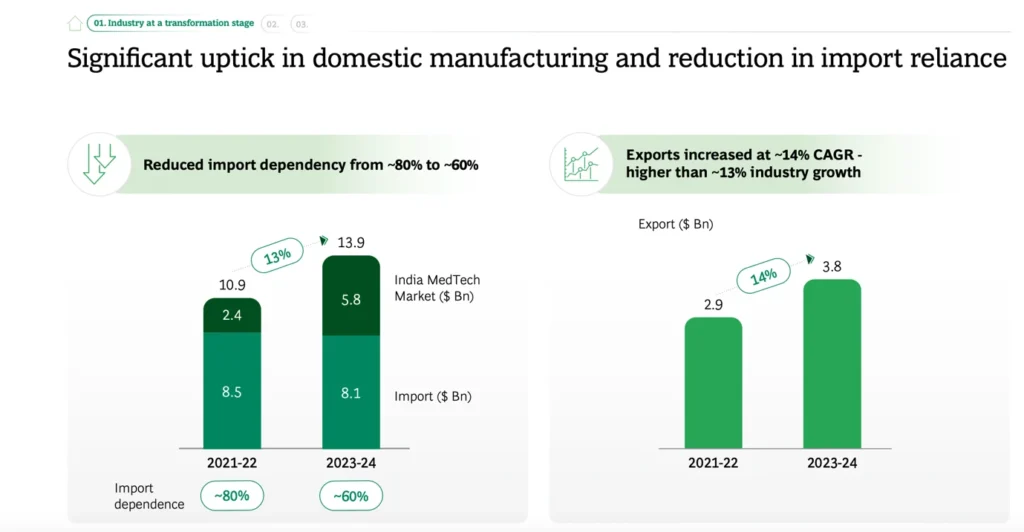
Import reliance in India’s MedTech market dropped from ~80% in 2021–22 to ~60% in 2023–24, reflecting stronger domestic production. Exports also grew at 14% CAGR, outpacing industry growth, highlighting India’s rising role as a global MedTech supplier.
10.India Offers the lowest MedTech Manufacturing Costs Globally.
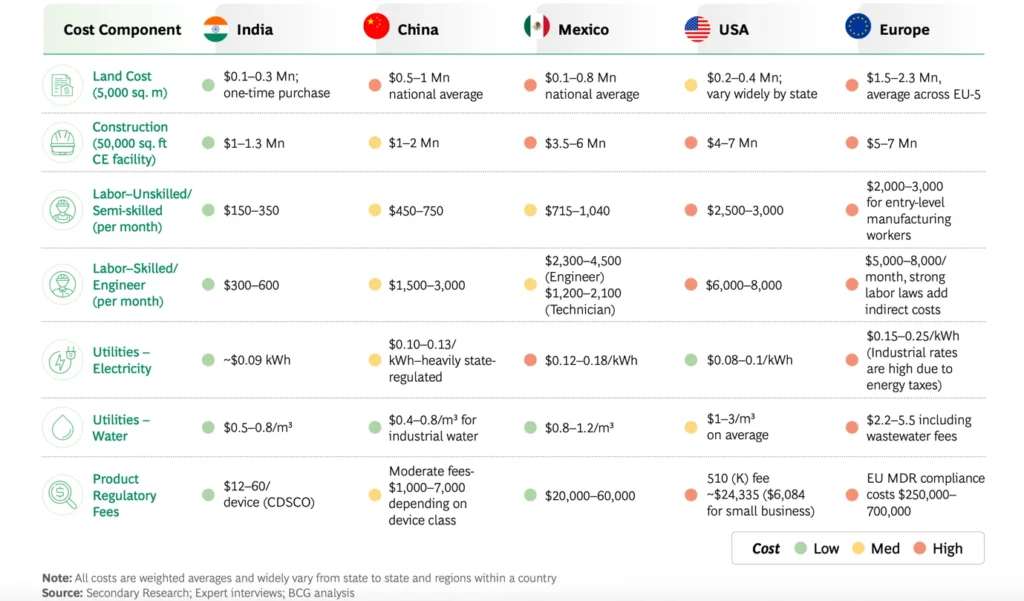
India’s land, labor, utilities, and regulatory fees are significantly lower than those in the US, Europe, and Mexico, making it a highly cost-competitive hub. These structural advantages, combined with rising local demand, position India as a strategic global MedTech manufacturing base.
11.Gold Loans Surge, MFI Segment Contracts in FY25
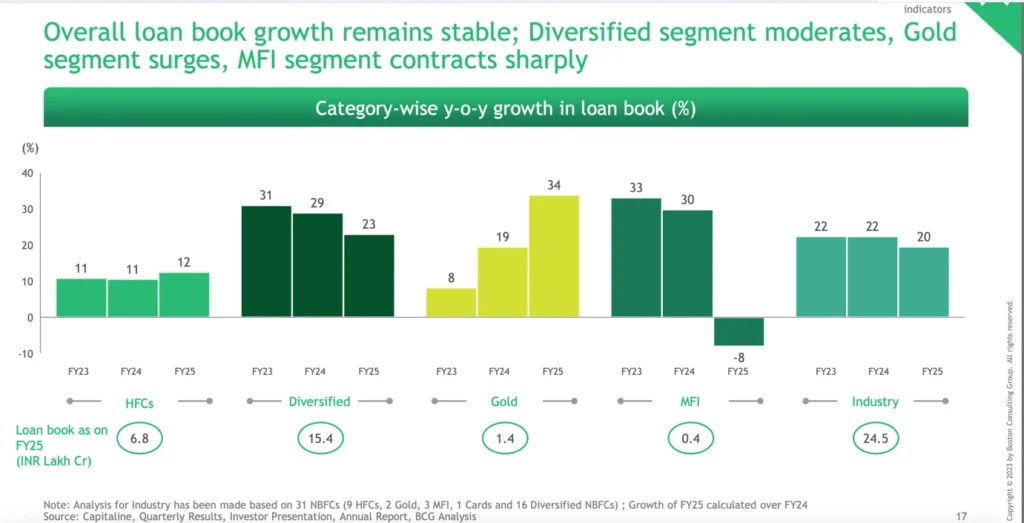
While overall loan book growth across NBFCs stayed stable at ~20%, Gold loans grew sharply at 34% in FY25. In contrast, Microfinance Institutions (MFIs) reported an 8% contraction, highlighting stress in the segment.
12. Mixed NBFC Disbursement Growth; Gold & Diversified Categories Lead
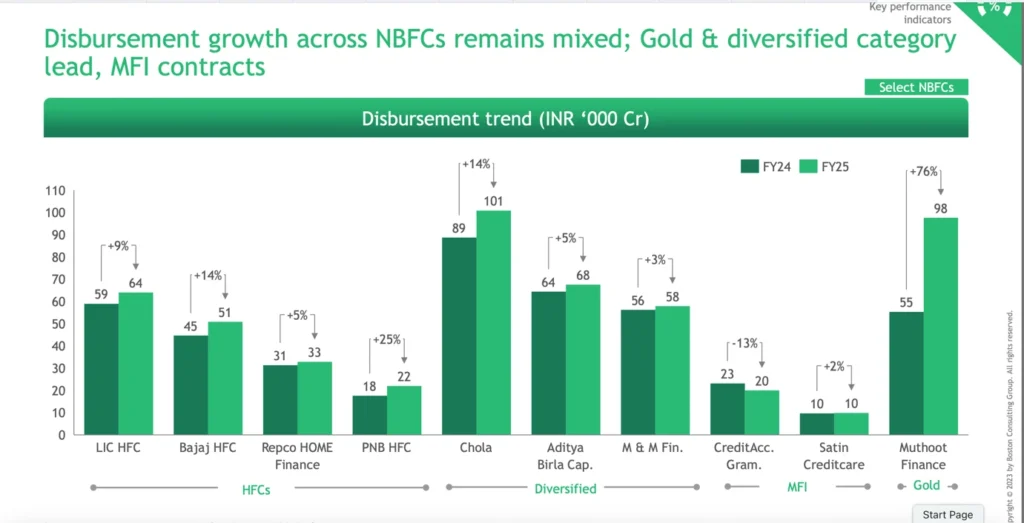
Gold lender Muthoot Finance saw a 76% jump in disbursements, while diversified player Chola grew 14% in FY25. Meanwhile, MFIs like CreditAccess witnessed a 13% drop, reflecting uneven performance across categories.
13. Indian Banks Double Tech Spend But Lag Global Leaders
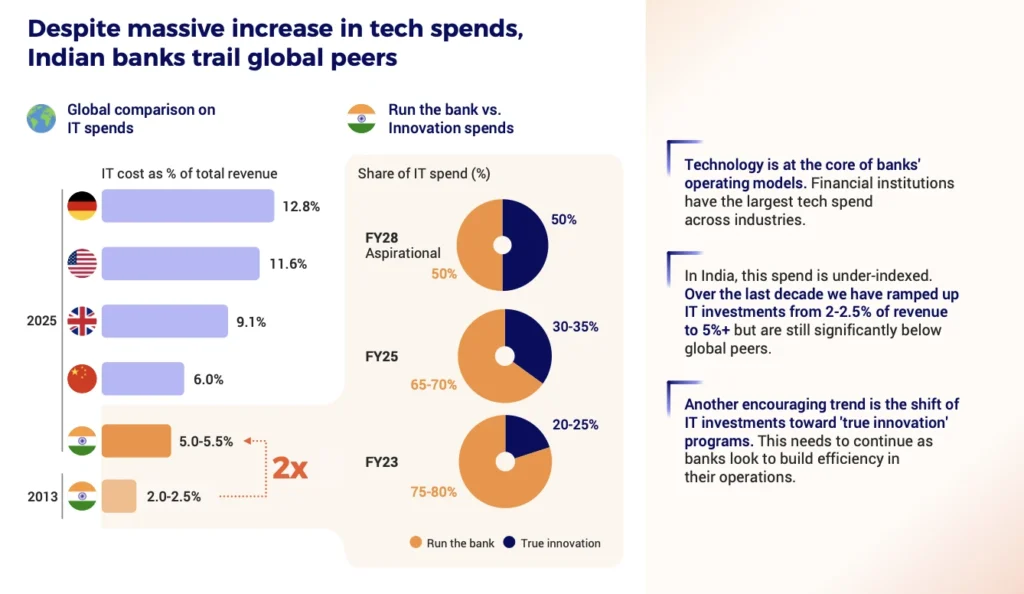
Indian banks raised IT spend from ~2% of revenue in 2013 to over 5% by 2025, still below peers like Germany (12.8%). A positive shift is greater allocation toward “true innovation,” set to reach 50% by FY28.
14. India’s Farm Economy Poised to Touch $3 Trillion by 2047
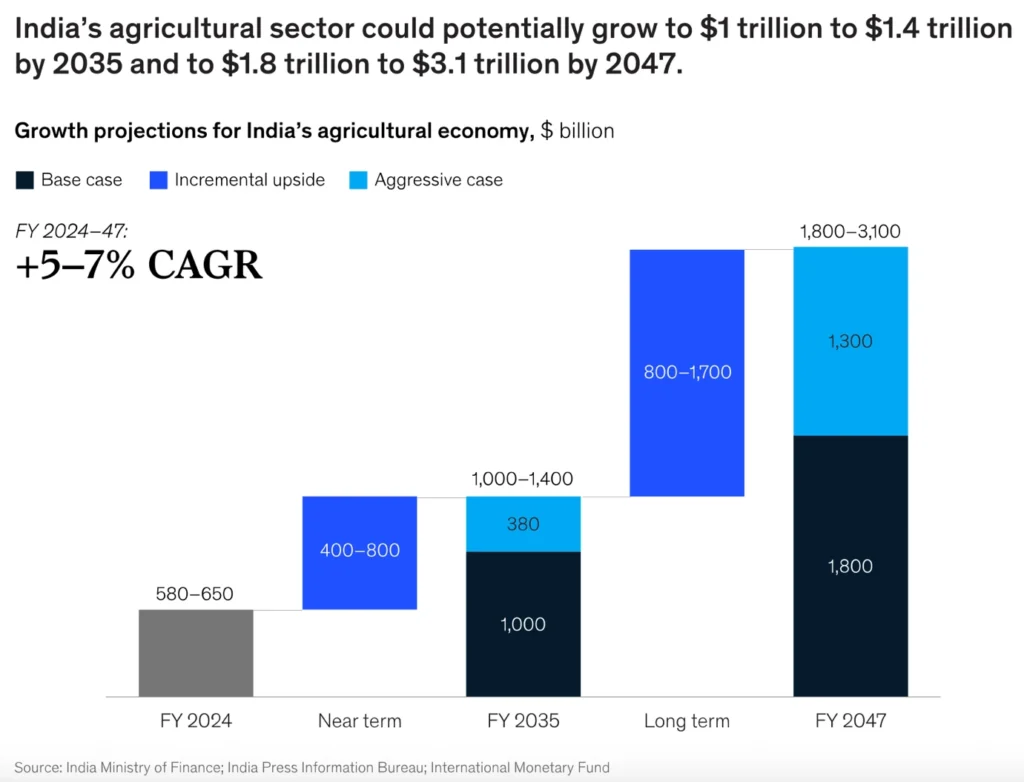
India’s agricultural sector is projected to grow at 5–7% CAGR, reaching $1–1.4T by 2035 and $1.8–3.1T by 2047. Incremental upside and aggressive cases highlight the sector’s role as a long-term growth driver.
15.China Tilts Exports Toward ASEAN, EU; US Share Shrinks
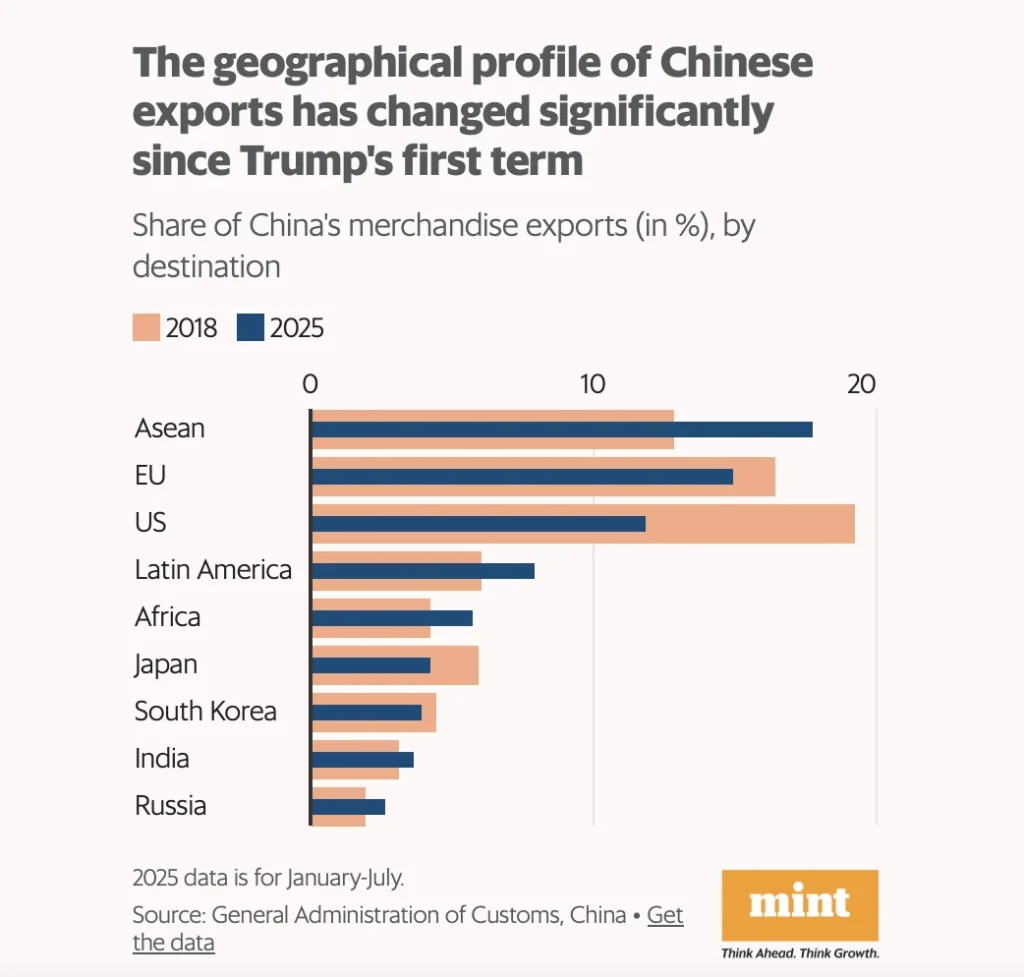
Since 2018, ASEAN has overtaken other regions to account for nearly 20% of Chinese exports, while the EU also gained share. Exports to the US declined, showing supply-chain rebalancing amid trade tensions.
16. 2019 Tax Cut Fails to Lift Private Investment
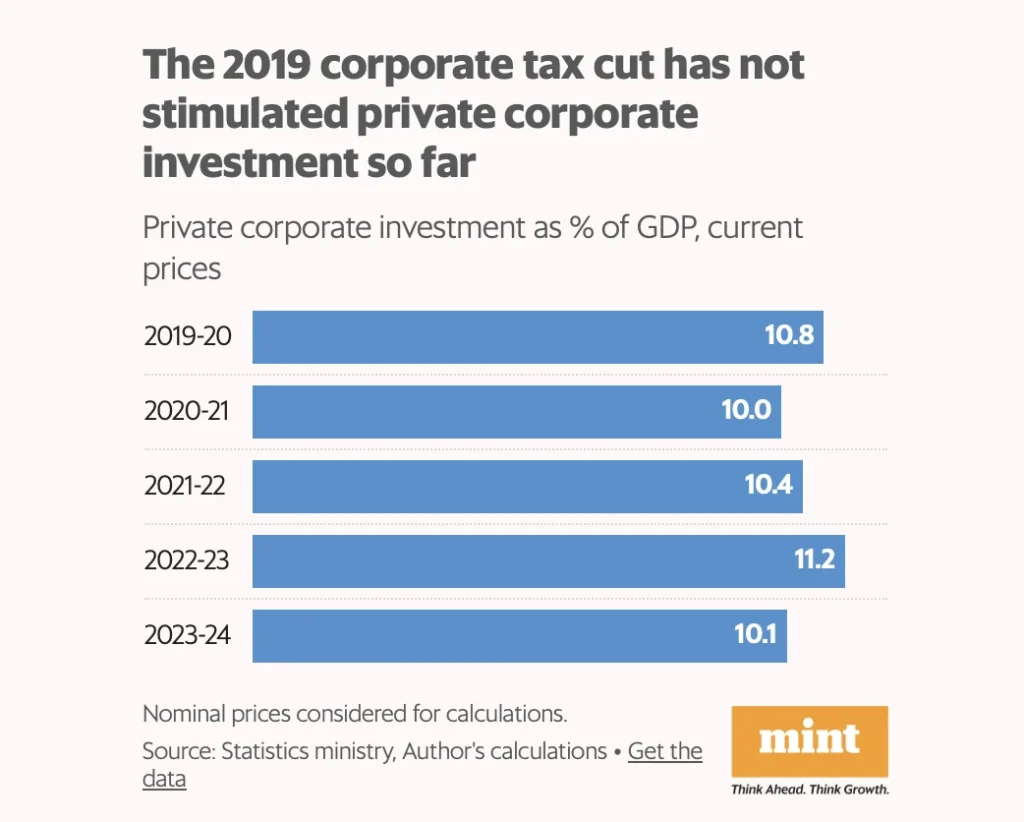
Private corporate investment as a share of GDP has stagnated around 10–11% since 2019, despite tax reductions. This indicates structural challenges remain in boosting private sector capex.
17. Mid-Caps See Sharp Drop in Loss-Making Firms
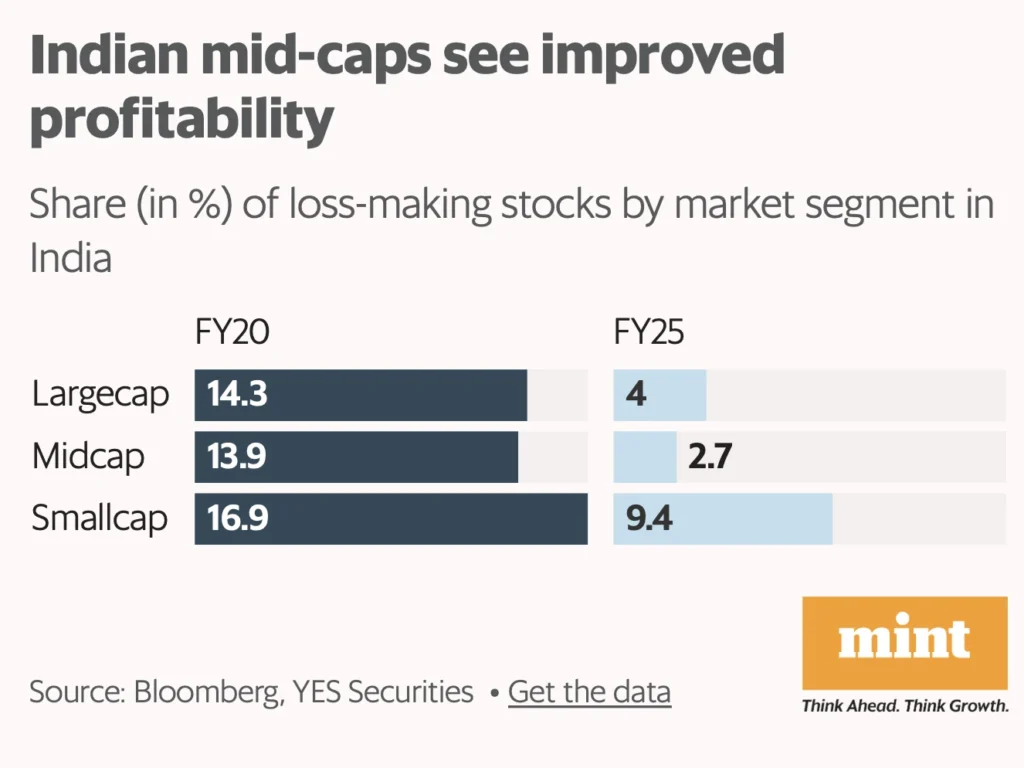
The share of loss-making midcap firms fell from 13.9% in FY20 to just 2.7% in FY25. Large-caps and small-caps also improved, but mid-caps showed the strongest profitability gains.


